
Infographics involve in-depth research into the subject, and require inventive thinking to produce accessible, accurate (and entertaining) graphics.
‘Thank you again for your creativity, patience and perseverence on this project. You are both a pleasure to work with.’ Linda Damerell, DTA, on Total Connector
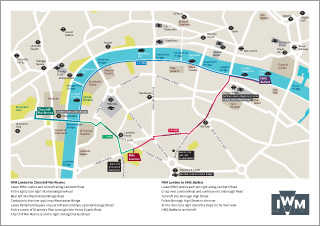
Map
IWM London
Map showing routes between the Imperial War Museum (IWM) and the two other London sites, Churchill War Rooms and HMS Belfast.


Presentation
DTA
Total Connector was developed in collaboration with the client to illustrate funding patterns and the central role of community anchors. We also developed interactive games for testing sessions and workshops. Illustrations: h+c.
download the total connector pdf presentation
see also digital
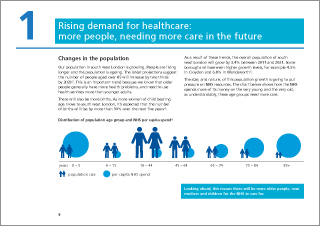

Statistics
NHS South West London
We needed to turn complex data into a clear idea that could be understood at a glance. By using simple icons, the problem of health spending in an ageing population could be communicated without using precise figures.
see also identity
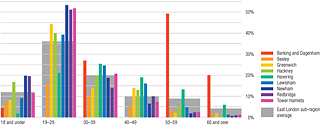
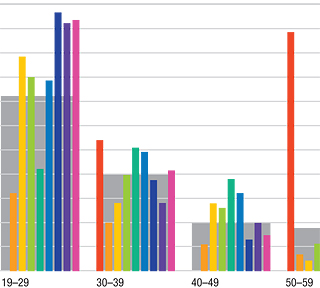
Graphs
East London CVS Network
This graph illustrates the age range of volunteers in the east London boroughs. The grey blocks represent the overall area average with each borough represented by a colour.
see also digital
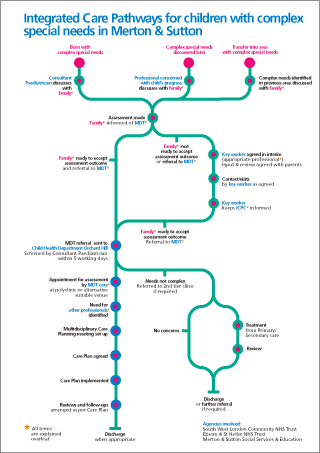
Clinical information
NHS
The clinicians involved wanted a clear graphic representation of how children with complex special needs should be referred through the system. Through the design process we helped clarify the system to those who were working in it.